
[Update 26 August 2018]
I have been an ardent supporter of vector maps for several years.. Compact, of low numerical weight, easy to update, they are perfectly suited to use on our mobile devices.
According to the good old adage that only fools don't change their minds, Recent technical developments in hardware and software, added to maritime events that have occurred in recent years, have led me to reflect on the correctness of my opinion. Trained in the old school of safety in Glénans Sailing School, The only bias I must allow myself to express is that of the safety of human life at sea. This may sound a bit "old-fashioned" for some, but I assume. Hang, It's going to be a long time.
Marine events
Since the beginning of this decade the press recounted of spectacular sea groundings related to navigation errors. For the most recent we can mention : the Marion Dufresne II in Crozet archipelago (2012), The’USS Guardian in Philippines (2013), Customs patrol boat Arafenua in Tuamotu archipelago (2014), and highly publicized VOR65 Team Vestas Wind during the 2nd leg of the Volvo Ocean Race. In all these groundings (except for the last one) Investigation reports damning human error have also implicated electronic charting and/or its interpretation, highlighting the lack of elementary prudence of boaters using inaccurate charts, or by nature, or their scale, either the seniority of the recorded surveys.
To consider only the two most recent groundings, It is clear that human errors concern the lack of discernment in relation to electronic charting whose vagueness ought to encourage boaters to more cautious in their approach to the dangers. Beyond the reports that I invite you to read richly (²), Let's look only at charting available on the crash scene.
• Patrol boat Arafenua, 1st June 2014, 4h00 Local.

 On Saturday night 31 May to June 1 2014, the Customs patrol boat Couach 32 meters DF48 'Arafenua' ran aground on the reef of atoll of Tikei, up to 300 MN northeast from Tahiti by 14 ° 56',504S and 144°32',436W on the north coast of Tikei
Provided with the application MaxSea on PC, an ECS equipment type, and not ECDIS (³), the watch crew uses a SHOM marine chart 6689 until 1:595.000, is a so-called ' landing' chart in the official nomenclature of paper charts. Unusable for a coastal approach, especially at night and in heavy rain falls. The position of the islet of Tikei in the Tuamotu archipelago, north of which the customs patrol boat ran aground, is incorrect on the SHOM chart 6689. Extract from the report :
[ The most accurate paper map is the " 6689 – Tuamotu Islands (western part) ”, the approach used for the. It is, View Scale (1/595 000), unusable for navigation in the direct vicinity of Tikei. It was established on the basis of bathymetric information collected by SHOM up to 1977. It was last updated in 2010. The geodetic reference does not appear on this map. On such a chart 1 mm represents 595 meters, the thickness of the pencil line (0,3 mm) represents 178,5 meters ] … [ The flat chart 6689 (ladder 1/595.000), Published in 1978, was established from the map 6057 (1/510000), which it replaced. Chart 6057, Published in 1952, uses a minute of topography also produced by the geodetic mission of 1948. The position of the island on the topographical minute is at 1 a thousand further south, probably due to a transcription error during the preparation of this document. This lag affected the map 6057 then the current chart 6689, and the ENC electronic navigation chart, FR266890 which were developed from the same paper chart.]
Excessively zooming the MaxSea PC a chart on such a scale, whose the most recent surveys are up to 1977, The utmost caution and a consequent margin of uncertainty are required. However the route drawn on the chart came 1 mm, thus 600 meters high, from the island. Most of our electronic charts display the same lag in latitude with the reference satellite location :
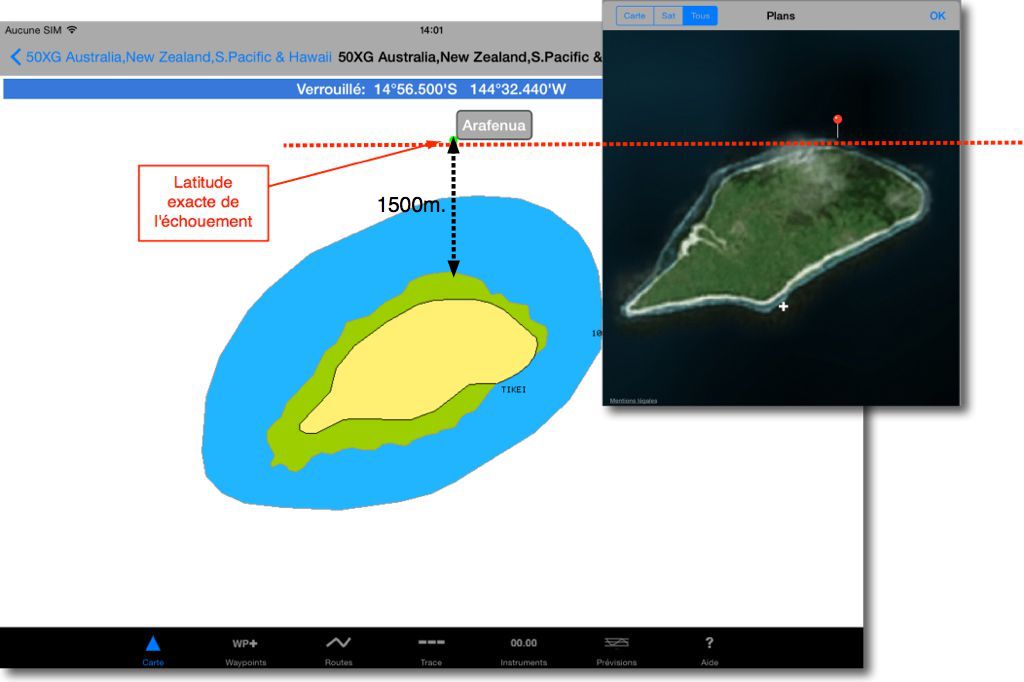
Navionics 50XG chart (iNavX). A difference of 1500 metres in latitude with the flat.

Chart CM93 (SEAiq). A latitude deviation of 1375 meters with the plate.

Chart Transas TX97 (iSailor). A difference of 1460 metres in latitude with the flat.
Le SHOM, after this accident, has published a correction to the chart 6689 for the position of the islet Tikei, But that doesn't solve the problem of scale, too much small to address these parts safely at night. Only a daytime visual watch combined with a cautious approach at low speeds allows this.
• VOR65 Team Vestas Wind, 29 November 2014, 19H10 Local.

 Shortly after sunset, Danish VOR65 runs aground south of Cargados Carajos Islands in Indian Ocean. Team Vestas Wind is provided with Expedition " Expedition is simply the best tactical and navigation software available ” (sic) and vector charting C-Map charts. After the grounding, the skipper Chris Nicholson spoke about a conversation he had with the Navigator Wouter Verbraak after noticing shoals on the charts :
"Wouter replied that the depth was from 3000m to 40m, "currents were not significant and the need to monitor the state of the sea in approaching this area."
This response confirms the theory that men have not seen the reefs on the charts. Wouter Verbraak :
"Looking back, We should zoom in on this area on electronic charts. It was a big mistake on my part not to have done it."
On his side, Yann Riou, reporter on board the VOR65 Dongfeng Race Team explains :
"This Charles archipelago (Caudrelier) had spotted him a few days ago, but we must admit that it is not easy to find. In fact to see it appear on our e-charts need to zoom at the top. But how and why zoom in when you don't know it's there."
Actually, on some vector charts and at certain zoom levels the dangers do not appear. And yet, SHOM chart 6884 until 1:10.000.000 (Indian Ocean Western part) represents all the dangers, islands and shoals, including the clearly visible Cargados. Furthermore these dangers are perfectly identified by the official publishers of charting (UKHO, NHO, NGA) (⁴). And several publishers use this information, as vector chart Navionics 30XG at virtually all levels of zoom, where the Cargados appear at scales greater than 1:8.000.000 (or a diagonal of 1.800 MN on a 10 screen″) :

On Navionics 30XG chart Southeast border of reefs is not at all hydrographied. The reef limit is approximate.

On the same chart at this scale, We see the lag with the satellite view. The charting is still more approximate.
It seems hard to believe that we can not see so extended reefs on electronic charts, unless the C-Map charts used are particularly deficient (⁵).
In this regard, a very informative thread on the Hisse and Oh forum reports many approximations found on vector maps, including Navionics, in certain countries of the globe. The conclusion drawn, In the end, by one of the posters (I salute by the way) is quite radical but imbued with common sense :
"There is a lesson for us to learn : It is not electronic navigation that is at issue, It is the exclusive use of vector charts (³). With electronic Raster charts (³) at small scale, this accident would not have occurred. These small-scale maps (as 1:3.500.000) have been developed by generations of hydrographers for mariners. These charts are almost caricatures, because they show very clearly in open seas small and large islets or even simple rocks."
Why use vector electronic boards exclusively? ? This did however not always so. The oldest of our French software, MaxSea, has developed its own MapMedia Raster mapping based on data from the official hydrographic services, starting with SHOM. And it still does. "Tile" display technology, developed by this company, Allows you to overlay scale levels as you zoom in/out. Combined with the power of the graphics cards in our computers, we get a smooth display of the different scales available, that is called a seamless display, seamless display in English. In addition, exponential capacity of hard drives offers widely enough room to store the large files of digitized charts. SO, What has changed ?
Technical and software developments
• Vector mapping
Vector maps appeared through two entirely different paths. Long story short,, computer vectorization techniques, developed for industrial software, such as AutoCad for the automotive industry, have made it possible to transform all the content of nautical charts into extremely compact databases, Easy to update : coast shorelines, boyage, bathymetry, texts, Independently editable. The first private publishers, Navionics charts, C-Map charts, have taken up this technique in the years 90 s to provide the first charts to the GPS becoming chart plotters. vector charts stored on cards (SD-Card, CF-Card) were a perfect fit for these new devices with limited memory capacity and rudimentary graphics processors, who made shipchandlers happy.
Parallel, The’IHO (International Hydrographic Organization) developed the basis for ECDIS (³), secured navigation systems based on the use of standard vector charts, developed by global hydrographic services around the world, and meeting the rules of the international convention SOLAS (³) imposed on commercial ships, passenger transport and deep-sea fishing. These standard charts, now accessible to yachting, are called ENC S-57, S-63 and S-100 (³). They are the only one allowed in place of the official hydrographic services paper charts.
At the same time, the evolution of boating chartplotters to more powerful devices, MFDs (Multi Functional Displays) translated by "traceurs" in French., and the gradual arrival of the laptops aboard leasure boats, have prompted the private cartography publishers to produce vector charts from S-57 official data , but do not meet the requirements of ECDIS. These charts, Called Private ENC, power the so-called navigation devices ECS (³), as opposed to ECDIS. These ECS are those we all own (or almost) aboard our cruising and regatta boats.
Everything would be for best in the best of worlds if the ENC corresponded to the needs of the recreational boating. Alas, it's nothing. Acquiring them is tedious, requires a device or software with a user permit (⁶), they are distributed in the form of numerous cells which the addition becomes quickly expensive, and moreover only cover the main routes of maritime traffic. So not at all suitable for boating. That is why we saw multiply private publishers of electronic charts, in addition to MapMedia veterans, C-Map and Navionics, we now find Garmin, Sex, Imray charting, NV Chart, Solteknik. and so on.
• Raster charting
Faced with the increase of vector charts, Raster charts have lost their attractiveness. Publishers such as SoftChart and the American MapTech each of which had a worldwide catalogue of Raster maps have disappeared. Have hardly survived MapMedia, "stainless" in its management of Raster charts, with TimeZero technology allowing a 3D display added to the most beautiful effect satellite imagery, UKHO with its ARCS catalogue (³), and NOAA, US administration which still distributes free RNCs charts (³) for the whole coasts of the USA. With equivalent geographical coverage, Raster charts need ten times more space in storage, and are almost unusable with applications not able to process seamless display, because all the items in a scanned chart increase by zooming-in, or decrease in zooming-out, which is totally inappropriate for a good charts reading.
And yet, A new phenomenon will bring this technology back to life…
Mobile devices
For almost ten years, science fiction devices have appeared : Smartphones and tablets. In a few years millions of mobile devices was sold, and it did not take longer time that developers design applications (no more say software) for navigation. This blog is one of its most ardent promoters. Charting publishers rushed : Navionics charts, C-Map charts, Garmin, Imray charting, Sex, and also developers of navigation applications, independent of cartographers (iNavX, SEAiq).
Vector charting meeting these small devices : Little graphics power, Low Storage, poor memory, The dream ! The entire Navionics global catalog can be stored in less than 5 GB of storage memory, wherever 50 Go wouldn't be enough for MapMedia. So voilà : Now these hyper-popular gems are going around the world aboard pleasure boats, and become real ECS. And mariners around the world discover that vector charting flawed. Based on official data, but not always up to date (See above), Reprocessing and transformations by editors can also add human transcription errors. Some publishers do not always transcribe the details they have (¹), either they forget them as Easter Island that recently disappeared from Navionics charts, and few application proceeds the overzoom (Excessive enlargement providing no more detail than the original scale) (⁷). In addition, the cartographic generalization of information according to levels of zoom display corresponds to arbitrary algorithms whose results are sometimes disturbing (total disappearance of the texts with Transas, in example). All this is a mess, and maritime safety is at stake. Of course, We must temper the remarks. To my knowledge and that of the many users of the iNavX application, Navionics still remains today the vectorial cartography covering the better the globe, Best updated, and the most detailed, even if it is not perfect.
Raster charts coming back
Facing the vector charts available for leasure boating, Raster charts have multiple disabilities : No detailed global coverage, large size of files, slow display and lack of connection between the different scales. But if we can fix these objectives shortcomings, they have considerable advantages : manual chart design by professional hydrographers, Richness of the graphic interpretation of reliefs, coasts contours, rockfill and objects which often stem from a true artistic creation, textual information related intimately to each scale level, no computer reprocessing a posteriori Error Generator, as for example a dotted isobath (meaning of uncertain soundings) turning into continuous isobath on the private vector charts. Short, the great come back to Dady's paper chart. But how ?
 MaxSea initiated the first simmering of the come back of Raster charts in June 2013 by launching its Apple iOS application TimeZero. MapMedia maps were embedding on iPad, with a very successful interface in line with the basic version on Windows. Alas ! Development was put on hold in November 2013, and apart from the support of AIS and Furuno WiFi Radar in 2015, Little has been done to this application.
![]() Weather4D drove the point home by presenting at the Paris Boat Show 2014 the Navigation module of its now famous weather app in its version under Android. In 2015 The iOS version has been completely re-developed to integrate the navigation module with the Weather4D Pro weather-routing version, under the name Weather4D 2.0. One of the main particularities is to rely on a catalog of raster maps, directly from the official hydrographic services : SHOM, UKHO, BSH, NOAA, CHS, etc,, served in the form of tiles by the French platform Geogarage.
Weather4D drove the point home by presenting at the Paris Boat Show 2014 the Navigation module of its now famous weather app in its version under Android. In 2015 The iOS version has been completely re-developed to integrate the navigation module with the Weather4D Pro weather-routing version, under the name Weather4D 2.0. One of the main particularities is to rely on a catalog of raster maps, directly from the official hydrographic services : SHOM, UKHO, BSH, NOAA, CHS, etc,, served in the form of tiles by the French platform Geogarage.
The developer has solved the problem of displaying these maps using the tile technique, allowing a very smooth sequence of the different levels of scale as the zoom in/out progresses. No more buy charting, one subscribes yearly to the full chart catalog of an editor (SHOM = 60 €/year). As many cards can be loaded into memory as there is space available, tiling allows for a compression ratio that significantly reduces the weight of the cards.
The highest mentioned technical disabilities are therefore solved, remains still incomplete global coverage. The maps are made available by the Geogarage server, Who buys, stores and keep available the international catalogues. Geogarage continues to negotiate with the world's hydrographic services to make their nautical chart catalogues available on its server. The subscription can be used on several devices.
These two major players of tablets navigation application will therefore devote the comeback of Raster charting, to the delight of a majority of us, and cartographers who will see their work recognized for its true value.
—
(¹) Comparative mapping, a mixed result
(²) Investigation Reports :
BEAmer Marion Dufresne report.
BEAmer Arafenua Report
The organizer of the VOR commissioned an independent investigation report that was made public on 9 th 2015.
(³) See Glossary for the definition of these terms.
(⁴) See the article by Geogarage Questions asked about volvo Ocean Race
(⁵) See Olivier Chapuis' harsh analysis on its built-in blog.
(⁶) ENC user permit, what is ?
(⁷) Electronic charts : scales and overscale [Update]
(⁸) The stakeholders of electronic charting
—
Whew ! Read all, I felt a little (A lot) Dinosaur with my paper cards, Compass and rope end, for my navigation. The fact remains that serious sailing will always be the safest.
About alignments and sextant
Bonjour,
I read with interest your article which reminds me of another accident.
The Maritime Accident Inquiry Board (the British equivalent of the BEAmer) investigated the sinking of the yacht Isamar which had crashed on 17/08/2013 on the weakly submerged rocks of the Great Olmeto Reef in Corsica. The ECS did not show the rocks at the mapping display scale at the time of the accident (http://www.maib.gov.uk/cms_resources.cfm?file=/Isamar_Report.pdf).
Kind regards.
Thank you for this particularly didactic information in this area very frequented by our compatriots. It is interesting to note that Navionics (46XG/43XG regions in iNavX) already displays the Great Reef of Olmeto on a scale 1:1.000.000 then at all the higher levels. With Transas TX97 (iSailor) it does not appear (marked 0,1) that at the 1:200.000 and his name does not appear until 1:67.000. With C-Map (Plan2Nav) It's a disaster : a generic name displays "Olmeto Reefs" above 1:200.000 but the Grand Ecueil is never rated, represented only by a black dot, and a dotted circle at the largest scales. All the probes are rounded and approximate.
– First, Thank you for this continuation (I've been a subscriber for two and a half years) rich and relevant feature articles, expression of mastered technical knowledge, enlightened by effective personal practice. But…
– But suddenly the conclusion is unwelcome. She was even the one who prompted me to comment. By dressing in Dutronc's jacket, you are putting on a suit that is not made for you. Your article above is an expression of tangible intellectual honesty, not that of an opportunist who seeks to please. By changing your review of Raster maps, you are not turning your back, You update your point of view in the light of an experience enriched by new facts by integrating them into your reflection.
Thank you for continuing to share your insights with us.
Sincerely.
Hello,
Bravo for this questioning, And a big congratulations for the ever-renewed interest of your columns.
For my coastal navigations from southern Brittany for which routing would be superfluous, I've been using since 4 years IMRAY (raster charts) whose maps are indeed reliable (especially since the acquisition of SHOM cards), Clear, with sufficiently equipped software.
They even introduced currents and tides, which is very useful.
Kind regards
Note that for 30 euros, or the price of the Indian's paper truck, Team Vestas could have avoided this accident. However, all the navigation manuals say and repeat that it is essential to check your route on a paper chart before setting off.
Excellent article, très lucide. Merci pour vos écrits que je lis toujours avec passion !